Congratulations to the winners of the 2012 Perceptual Edge Dashboard Design contest, Jason and Shamik. Great work! Their entries can be found here: http://www.perceptualedge.com/blog/?p=1374
You can see some of the other entries by going to http://www.perceptualedge.com/discussion.htm and look for the Dashboard Design subject. Here's my entry created in Tableau - of course! As always, any and all feedback is welcome. Thanks!
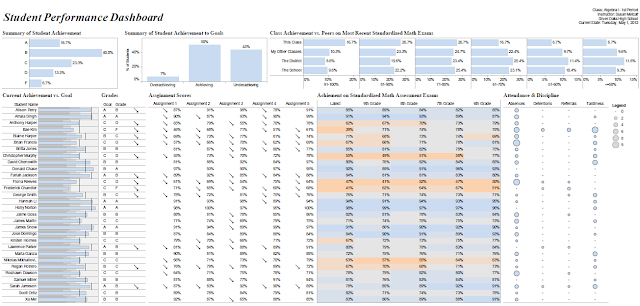 |
| Click on the image to open in Tableau Public |
There are some design aspects of your dashboard that I like better than the winner. I like your bullet charts better as well as the bar charts at top comparing class achievement vs peers. I also like how you included the heat map. Are you coloring based on individual performance against themselves or against the class as a whole or against some sort of average?
ReplyDeleteI remember looking at the data for this contest. There was a lot to put together and synthesize. I think you did a nice job!
Thanks Rob. The heat map coloring is based on individual performance against the class as whole. What's cool about this contest that a lot folks are posting their entries at the perceptual edge discussion board. I think it's becoming the largest collection of Stephen Few inspired dashboards on the web. At least it's the biggest collection I can think of.
ReplyDelete